

Average Mortgage compared to Average Wage
 Jun 12th 2009, 10:41 am
#1
Guest
Posts: n/a
The following figures show the average Home Mortgage against the average Male Full time wage for April 2009, for each State.
Note: the average wage figures do not include proprietors/partners of unincorporated businesses, self-employed persons or non salary directors.
- NSW $283,300 against $69,253 or 4.09 times Male income
- QLD $270,800 against $66,518 or 4.07 times Male income
- VIC $249,000 against $66,970 or 3.72 times Male income
Note: the average wage figures do not include proprietors/partners of unincorporated businesses, self-employed persons or non salary directors.
Jun 12th 2009, 10:54 am
#2

Joined: Jun 2006
Posts: 4,555

Another perspective from demographia
 Jun 13th 2009, 12:22 am
#3
Guest
Posts: n/a
One problem with the demographia results is that they show Sydney as being a multiple of 8.3 on their comparison charts (London being 6.9)
If demographia are correct, at 8.3, then the median price for NSW, (not just Sydney) must be 8.3 x $69,253 = $574,800.
So with a median property price of $574,800 and a median mortgage of $283,300, the average deposit is $291,500.
If those Demographia figures are correct, the people of NSW are not doing badly at all.
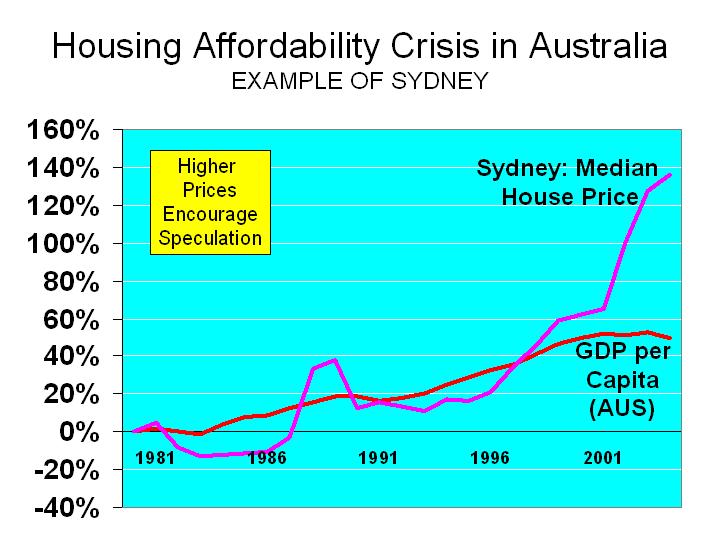
An interesting thing about that graph, although looking spectactular, is the actual figures.
Assume 1981 was $100,000 for a house
Then a 140% increase to 2003
That would mean the same house in 2003 would cost $240,000
That works out an an average annual increase of 4.075%
The Average NSW wage in Nov 1983 was $400 pw
In Nov 2008 it was $1,328.40 pw
That works out an an average annual increase of 4.92%
Wages have gone up faster than house prices ?
Something looks wrong with those Demographia figures.
If demographia are correct, at 8.3, then the median price for NSW, (not just Sydney) must be 8.3 x $69,253 = $574,800.
So with a median property price of $574,800 and a median mortgage of $283,300, the average deposit is $291,500.
If those Demographia figures are correct, the people of NSW are not doing badly at all.
An interesting thing about that graph, although looking spectactular, is the actual figures.
Assume 1981 was $100,000 for a house
Then a 140% increase to 2003
That would mean the same house in 2003 would cost $240,000
That works out an an average annual increase of 4.075%
The Average NSW wage in Nov 1983 was $400 pw
In Nov 2008 it was $1,328.40 pw
That works out an an average annual increase of 4.92%
Wages have gone up faster than house prices ?
Something looks wrong with those Demographia figures.
Jun 13th 2009, 9:04 am
#4
Joined: Jun 2006
Posts: 4,555
Depends on sources and statistical techniques used.
One anecdotal observation I have made recently is the number of to let signs around. Previously an ad in the SMH would have had done. A nieghbouring unit has been vacant for 5 weeks now.
I saw a couple of houses today. There appears to be more buyers and sellers on the market which is a good sign. Agents are desperately trying to hide the drop in prices by handing out selective recent sales and not publishing sales results.
One problem with the demographia results is that they show Sydney as being a multiple of 8.3 on their comparison charts (London being 6.9)
If demographia are correct, at 8.3, then the median price for NSW, (not just Sydney) must be 8.3 x $69,253 = $574,800.
So with a median property price of $574,800 and a median mortgage of $283,300, the average deposit is $291,500.
If those Demographia figures are correct, the people of NSW are not doing badly at all.
An interesting thing about that graph, although looking spectactular, is the actual figures.
Assume 1981 was $100,000 for a house
Then a 140% increase to 2003
That would mean the same house in 2003 would cost $240,000
That works out an an average annual increase of 4.075%
The Average NSW wage in Nov 1983 was $400 pw
In Nov 2008 it was $1,328.40 pw
That works out an an average annual increase of 4.92%
Wages have gone up faster than house prices ?
Something looks wrong with those Demographia figures.
